|
Refractive Outcome Graphs |
  
|
|
Refractive Outcome Graphs |
|
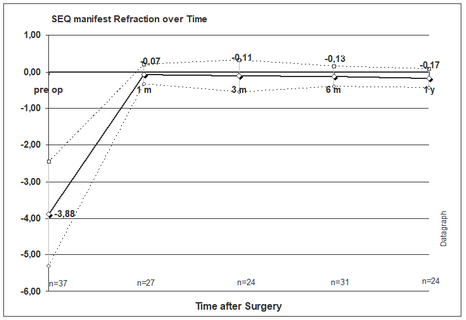
The SEQ manifest Refraction over Time graph can be found under 'Refractive outcome'. This graph plots simply average pre and postOP manifest refraction SEQ. This graph shows the actual refraction independent from any given target refraction and should not be used for patient groups which includes eyes with a target refraction other than plano. See 'Stability' graph.