|
HO RMS |
  
|
|
HO RMS |
|
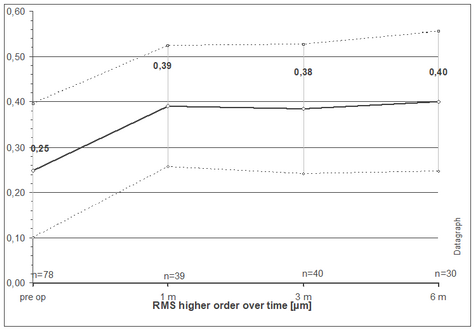
The probably most popular Zernike based graph is amount of higher order RMS (HO RMS) over time. It shows whether or not higher order aberrations have been induced.
The graphs plots the mean value of HO RMS ±1 Standard deviation in microns (y-axis) for different follow up points (x-axis). The number of eyes per follow up is given in the lower part of the graph (n=...)
Datagraph-med calculates the HO RMS value of all Zernike Terms in 3rd to 6th order.
Typically HO RMS values for a 6 mm pupil should be in the range of 0.3 to 0.4 µm.