|
Double-Angle Cylinder Plots |
  
|
|
Double-Angle Cylinder Plots |
|
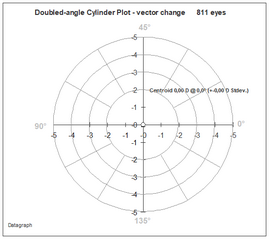
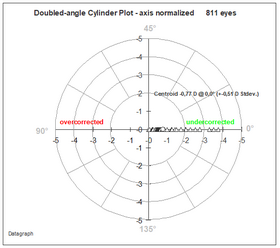
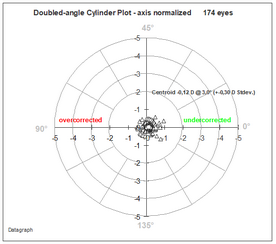
The 'double angle cylinder plot' shows the cylinder magnitude and axis distribution on a polar coordinate grid. The cylinder axis is doubled on this graph, showing axis values of 0 and 180° in the same position.
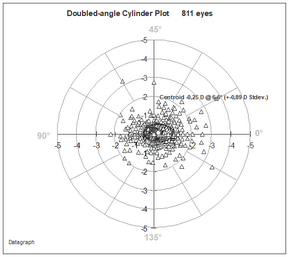
The simplest form of double angle plots just show the actual cylinder axis and magnitude distribution at the selected time interval. A Centroid value, surrounded by an ellipse of one Stdev. is giving the vectorial average cylinder value. Left image PreOP, right image postOP.
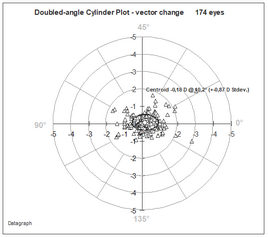
The second type shows the change in axis compared to preOP as 'normalized double angle cylinder plot'. This graph may indicate any systematic induced axis change between preOP and postOP as well as an overall cylinder over- or undercorrection. (left preOP, right postOP)
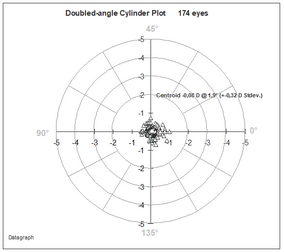
The third type of double angel scatter plots show the vectorial magnitude and axis changes at a certain time interval. (left pre, right postOP)